
The following is a guest post by Philipp Prettl and Lion Weber (University of Konstanz), with support from Simon Munzert.
Did you ever want to track trending topics on Twitter, but missed to start the tracking as an event took off? Are you interested in mining massive amounts of Twitter data using R, but lack the tools to store all tweets in a database? If yes, this post might be what you've been waiting for.
We are happy to introduce our new package TwitteR2Mongo, which connects the Twitter API to MongoDB using R. The idea is the following: Based on your personal network, i.e. the people you follow on Twitter, the package tracks trends and topics and starts to collect all tweets linked to hot topics. To facilitate processing large collections of tweets, the gathered data are stored in a MongoDB database.
More precisely, what the package does is the following:
- It accesses Twitter's REST API to pull the home timeline of the user.
- It identifies trending topics in the user's home timeline. Keywords are updated dynamically when new tweets appear on the user's home timeline. Alternatively, you can manually specify a query with a set of keywords.
- Using the Streaming API, it filters all tweets that are connected with previously set keywords.
- It offers a range of high-level functions to access and process data from the MongoDB database that runs in the background.
Getting started
To use this package, a working MongoDB installation is required. Current releases for all major operating systems are available here. You can start the MongoDB server by running:
mongod
Alternatively, you can manually run the executalbe mongod.exe in the bin directory (e.g., at C:/Program Files/MongoDB/Server/3.0/bin). If it is the first time you start the MongoDB server, you need to create a writeable directory at C:/data/db (Windows). For a local MongoDB installation, the following information should be sufficient.
# Load the package
library(TwitteR2Mongo)
# Specify the two collections to use for storing the tweets
setMongoDbCredentials(type = "hometimeline", collection = "hometimeline", db = "twitter",
url = "mongodb://localhost")
setMongoDbCredentials(type = "filterstream", collection = "filterstream", db = "twitter",
url = "mongodb://localhost")

# Check the connection
hometimeline <- connect2MongoDb("hometimeline")
filterstream <- connect2MongoDb("filterstream")
Additionally, you need a Twitter account. Note that this account is important, because the package will look up its timeline and search for trending topics. That is, you should have a meaningful list of people you follow using this account. Next, you can register a Twitter app at: Twitter Application Management and get your Consumer Key (API Key) and Consumer Secret (API Secret). Make sure to set the Callback URL to: http://127.0.0.1:1410.
To connect to the Twitter-API, first set your credentials, using:
setAPICredentials(key = "your-API-KEY", secret = "your-API-SECRET")
makeOAuth()
Please use the option to store the oAuth in a file(.httr-oauth), as the streaming process will not work without it.
The home timeline
The home timeline contains up to 800 tweets posted by users you follow. Depending on how many users you are currently following, you should think about updating your hometimelime regularly.
# create a connection to the collection holding the home timeline
hometimeline <- connect2MongoDb("hometimeline")

# retrieve the most recent tweets via updateHometimeline()
updateHometimeline()
It is possible to restrict your queries to a specific time interval. getInterval() returns a Unix timestamp interval. Use Sys.setlocale("LC_TIME","English") because Twitter provides a timestamp (later the created_at field) which needs an English environment to be parsed properly. For details, see ?as.POSIXct. If no parameters have been passed on, the function returns an interval corresponding to the last hour. If you want to have an interval that is, e.g., equivalent to the last 24 hours, use getInterval(60*24) (i.e. 60 minutes times 24 hours). Further, you can pass on a vector of date times via the inputintervalparameter (see below). Refrain from using the times 00:00:00 and 12:00:00. They won't be parsed. Use 00:00:01 etc. instead. When working with the Twitter API, you should keep in mind that the dates provided are always in GMT.
# set digits to 13 in order see the exact unixtimestamp in ms
options(digits = 13)

# interval for the last hour
Sys.setlocale("LC_TIME","English")
getInterval()

# interval for the last 24 hours
getInterval(60*24)

# manually specified interval
timeframe <- c("2016-01-04 18:37:43 CET","2016-01-05 18:37:43 CET")
getInterval(inputinterval = timeframe)
Use topHashtagsInInterval() to extract the most frequently used hashtags from your database. Get the top 10 hastags in your network within the last 24 hours. If you want to access the tweets provided by the Streaming API, just substitute "hometimeline" by "filterstream" in order to access the other collection.
topHashtagsInInterval(hometimeline, interval = getInterval(60*24), 10)
topHashtagsInInterval(hometimeline, interval = getInterval(inputinterval = timeframe), 10)
Streaming tweets
Next, we can automatically retrieve all tweets from Twitter that contain relevant keywords or hashtags. By defailt, the filter looks for top hashtags from the home timeline. To get these tweets, we need to connect to the Streaming API. Once started, the package will continue to download and import tweets until we stop it to do so. The streaming process will be started in an additional R process, which administrates the streaming process separately. This allows you to keep on working in your current R instance. The timeout indicates after how many seconds the process is restarted with updated filter parameters. Don't use too low values, or otherwise you might be blacklisted by Twitter. You may also stream tweets independently from your home timeline. As shown below, you can specify various search queries. The streaming process can only be stopped by stopStreaming(). If a timeout occurs, then the process is not restarted with new filter parameters but terminated. The higher the timeout, the longer the maximum waiting time for the process to terminate.
WARNING: The streaming process may fill your hard drive with tens of GB of data per day and consume a lot of working memory. Execept for testing, we recommend to run it on a seperate with computer reasonable amounts of working memory. Additionally, in our experience running the process on a system with SSD helps prevent it from crashing, in particular if you expect lots of data coming in. Further, you should think about indexing your data. For further information on indexes and why they might be helpful, visit: https://docs.mongodb.org/manual/indexes/.
# start the streaming process
startStreaming(timeout = 300)

# start the streaming process with a specified query_url
startStreaming(60,"https://stream.twitter.com/1.1/statuses/filter.json?track=Trump")

# get a random sample of all tweets
startStreaming(60,"https://stream.twitter.com/1.1/statuses/sample.json")

# stop the streaming process
stopStreaming()
Inspecting the most important topics in your home timeline
After the streaming process has finished, we can extract all hashtags from the MongoDB that have been posted in the time interval specified in createIntervalVector(). createIntervalVector() takes two date time strings in the format "2016-01-14 23:00:01". You may also use the Twitter API format, for example "Thu Jan 15 13:38:00 +0000 2016". It then calculates a time interval specified by the second parameter in the function and returns the corresponding Unix time stamps. The example below creates an interval from the 14th of January 23:00:00 to the 15th of January 08:00:00, in hourly steps.
createIntervalVector(c("2016-01-14 23:00:01", "2016-01-15 08:00:01"),9)

# Which corresponds to:
 "2016-01-14 23:00:01 CET" "2016-01-15 00:00:01 CET"
 "2016-01-15 01:00:01 CET" "2016-01-15 02:00:01 CET"
 "2016-01-15 03:00:01 CET" "2016-01-15 04:00:01 CET"
 "2016-01-15 05:00:01 CET" "2016-01-15 06:00:01 CET"
 "2016-01-15 07:00:01 CET" "2016-01-15 08:00:01 CET"
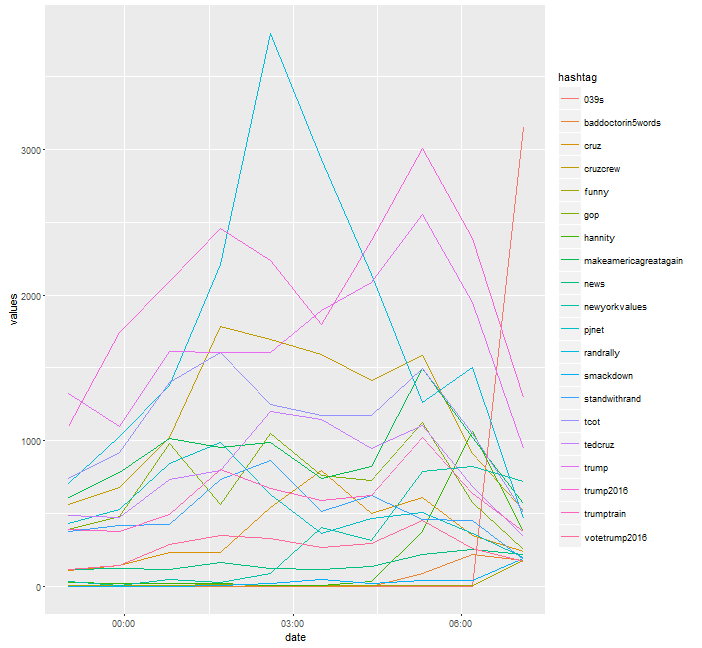
createTwitterTimeseries() then queries the mongoDB and extracts all hashtags from the respective time intervals and constructs a data frame. (Again a warning: If the amount of data is very large, this may take some time.) Additionally, rare tweets whose sum during the time interval are below a certain threshold are removed from the data frame. plotTweets() displays the top x hashtags with respect to the last time interval.
timeseries <- createTwitterTimeSeries(filterstream, c("2016-01-14 23:00:01", "2016-01-15 08:00:01"),10)
interval <- createIntervalVector(c("2016-01-14 23:00:01", "2016-01-15 08:00:01"),10)
print(plotTweets(timeseries[2:nrow(timeseries),], 20, interval))
If you want to get a ranked representation of your data frame, you can use
rankTweets(). The function ranks your tweets in the respective intervals, which may help identify if a hashtag has started trending.
rankmoving <- rankTweets(timeseries)
head(rankmoving, n = 10)
If you want to sum up the counts of the respective intervals, use absoluteHashtagCounts().
counts <- absoluteHashtagCount(timeseries)
Querying information from the MongoDB data base
Querying information from a data base can be a mess, in particular if requests build on unstructured content. The buildRegexQuery() function is meant to facilitate filtering data from your MongoDB data base. It constructs a JSON string that allows you to search the mongo fields entities.hashtags.text and text for certain hashtags or words, in a given time frame. Parameters you can pass on are regular expressions, a time stamp which defines your time interval (you can use getInterval() for that), the fields to be searched, the regex options supported by MongoDB, and a conjunction.
The example below builds a JSON string that looks for the hashtag #Trump in the time frame 2016-01-15 03:00:01 to 2016-01-15 04:00:01, in the fields entitites.hashtags.text and text. The conjunction $or ensures that only one of the used regular expressions needs to be found in a tweet in order for the tweet to be returned (In this case we are only looking for one, but you can extend that to many regular expressions). Using the conjunction $and results in returned tweets that match all specified regular expressions. Some of the parameters have a standard input; see ?buildRegexQuery() for more details.
interval <- getInterval( inputinterval =  c("2016-01-15 03:00:01", "2016-01-15 04:00:01"))
query <- buildRegexQuery(c("Trump"), timestamp = interval)
Now using filterstream$find(query, fields) returns a data frame with tweets that match the given character pattern in at least one of the three mongo fields text, entitites.hashtags.text and created_at, as specified by getMongoFields(). Note: Refrain from using regular expressions with the characters \, [ and ], since these are being replaced during the JSON string building process, thus falsifying your regex. Alternatively, you can use a dummy like "regextobereplaced" and replace that dummy with a complicated regex after you have used buildRegexQuery().
fields <- getMongoFields(c("text","entitites.hashtags.text","created_at"))
data <- filterstream$find(query, fields)
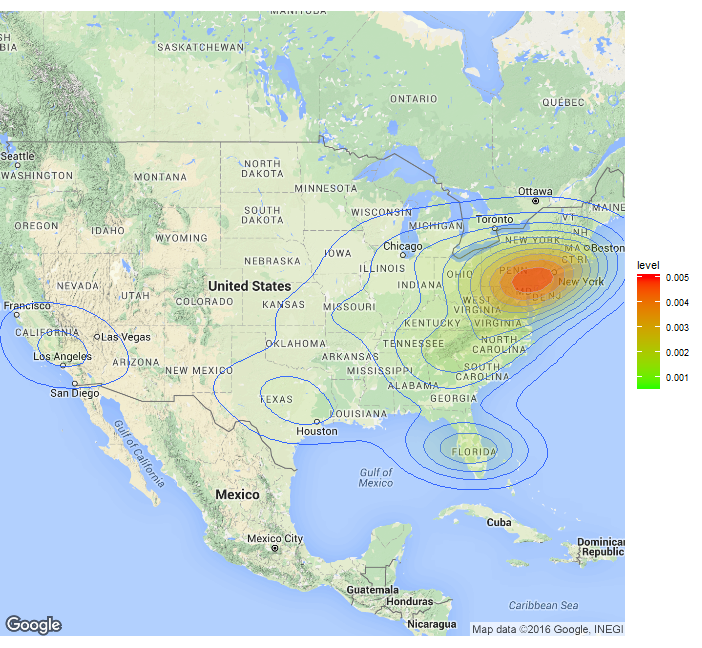
Tweets on a density map
A common task for Twitter miners is to geo-tag tweets. We provide some basic functionality for that. The function extractCoordinates() looks up the geo information of the tweet and retrieves it.
data <- extractCoordinates("filterstream", "Trump", 1600)
One can augment the number of geo-tagged tweets by using the user-location field. Applying the geocodeDataFrame()function, this text field is converted to lon/lat coordinates using the Google API. To avoid a cluster of tweets in the "center" of the country, one should remove the tweets only containing the name of the country.
data <- data[data$user$location != "USA", ]
data <- data[data$user$location != "United States", ]
data <- data[data$user$location != "United States of America", ]
result <- geocodeDataFrame(data)
drawMap(data = result, location = "USA", zoom = 4, fill = TRUE)
Log files
Finally, you might be interested in tracking the streaming process itself for debugging or other purposes. The process creates two logfiles, as the seperate R instances cannot print information to the console, and store them in your working directory.
We hope you have fun trying out our TwitteR2Mongo package! If you have any comments or questions, we are looking forward to hearing from you. If you want to contribute to the package, just file an issue on GitHub. And: Stay tuned on the blog! We are going to publish a little case study using the package within the next few days.